Month End Special 70% Discount Offer - Ends in 0d 00h 00m 00s - Coupon code: save70

Free and Premium Qlik QSBA2024 Dumps Questions Answers

Page: 1 / 4
Total 50 questions

Qlik Sense Business Analyst Certification Exam-2024 Questions and Answers

Question 1

Refer to the exhibit.
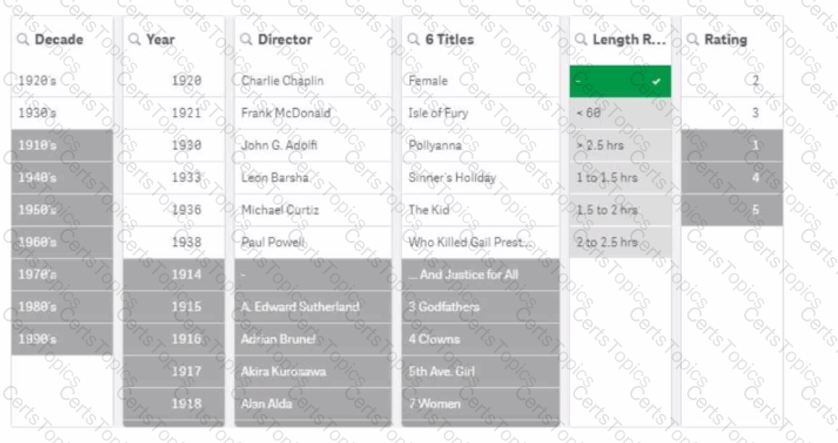
A movie analyst is using an app to gain insights into films created in the early 20th century. The analyst reviews the filter for Length Range, notices a hyphen "-", and selects it.

What can the analyst determine from the resulting filter panes?

Options:

A.

Six movies in the source data contain illegal characters for the Length Range field.

B.

Movies at the start of the 20th century often varied in length.

C.

All movies from the 1920s or 1930s contain no data for Length Range.

D.

The source data for six movies is missing a Length Range.

Buy Now
Question 2

A company has sales data where every Customer ID can be assigned to one or more Sales Account ID. Sales Accounts are assigned to one of eight Groups. The business analyst is creating an app with the following requirements:

• Each Group should have a separate sheet

• The Sales Account can only see its own customers

• The Sales Account can navigate only to the sheet for the Group assigned

The business analyst has created a Section Access table, in which each Sales Account ID is assigned their CustomerlDs. Which action should the business analyst take next?

Options:

A.

Use the Sales Account ID as a filter on the show/hide condition on the relevant sheet

B.

Use the Group as a filter on the show/hide condition on the relevant sheet

C.

Use the Group field within the Section Access table, then apply it to the show/hide condition of the sheets

D.

Use the OSUser()function within the show/hide condition of the sheets to set the required visibility

Question 3

A customer is developing over 100 apps, each with several sheets that contain multiple visualizations and text objects. The customer wants to standardize all colors used every object across every app. The customer also needs to be able to change these colors quickly, as required.

Which steps should the business analyst take to make sure the color palette is easily maintained in every app?

Options:

A.

• Design all base objects as master visualizations

• Link each object in each app to the relevant master visualization

• Adjust the data properties as required

B.

• Develop the first app with every variation of object and visualization that will be required

• Duplicate this app to create every other app

• Remove the variations that are not required and adjust the ones needed

C.

• Create all color expressions as variables in a text file

• Load it in each app with an include statement

• Use these variables in the color property of all objects

D.

• Store color definitions within a .qvd file

• Have each app load this file as a data island in the model

•Have every object select its required color property from the rows within the data island

Question 4

A business analyst needs to create a visualization that compares two measures over time using a continuous scale that includes a range. The measures will be Profit and Revenue.

Which visualization should the business analyst use?

Options:

A.

Line chart

B.

Bullet chart

C.

Bar chart

D.

Scatter plot

Question 5

A business analyst using a shared folder mapped to S:\488957004\ receives an Excel file with more than 100 columns. Many of the columns are duplicates. Any current columns that should be used have the suffix '_c' appended to the column name.

Which action should the business analyst take to load the Excel data?

Options:

A.

Load all columns because the recommended associations will use only columns with the suffix '_c'

B.

Utilize filter functionality in the Data manager to select only columns with the suffix '_c' with a filter condition

C.

Open the Excel file, remove all columns that do not have the suffix '_c', and save the file to be loaded

D.

Deselect the fields that do not have the '_c' suffix in the Data manager table preview

Question 6

A banking organization needs a dashboard that shows the following:

• A KPI indicator for current year (CY) versus last year (LY) revenue

• A scatter plot that shows the cost versus revenue of product categories

• A treemap that shows average customer satisfaction rating based on regions

• A table that shows CY cost by record number, financial instrument, and bank

In addition to the customer satisfaction rating, which fields should be used to create the required measures?

Options:

A.

CY Revenue, LY Revenue, CY Cost

B.

CY Revenue, LY Revenue, Cost

C.

Revenue and Cost

D.

Revenue and CY Cost

Question 7

A business analyst needs to create two side-by-side charts for a sales department with the following data:

• Number of orders

• Name of the customer

• Percentage of margin

• Total sales

The charts use a common dimension, but each chart has different measures. The analyst needs to create a color association between the two charts on the dimension values.

Which action should the business analyst take?

Options:

A.

Use nested IF statements to set the colors by expression for each dimension value

B.

Define the color values in the master measures and use the color library

C.

Select 'By Dimension' and 'Persistent colors' in the Colors property panel

D.

Use the Fieldlndex function to set the colors by expression for each dimension value

Question 8

A business analyst needs to rapidly prototype an application design for a prospective customer. The only dataset provided by the customer contains 30 fields, but has over one billion rows. It will take too long to keep loading in its entirety while the analyst develops the data model.

Which action should the business analyst complete in the Data manager?

Options:

A.

Split the dataset and create a normalized star schema of associated tables

B.

Deselect text columns with unique data values to reduce the memory footprint

C.

Use the Filter data option to reduce the number of rows

D.

Truncate text fields longer than 256 characters to create preview fields

Question 9

A company director who spends very little time in applications needs to be informed when a threshold is breached. Which feature should the business analyst use?

Options:

A.

Weekly PDF report

B.

Storytelling

C.

Alerting

D.

Bookmark

Question 10

A business analyst is creating an app for the sales team. The app must meet several requirements:

• Compare 10 top-performing sales representatives and the amount of sales for each

• Investigate margin percentage and total sales by each product category

• View distribution of sales amount

Which visualizations should be used for this app?

Options:

A.

A bar chart, scatter plot, and histogram

B.

A treemap, container, and distribution plot

C.

A bar chart, line chart, and scatter plot

D.

A treemap, box plot, and histogram

Question 11

A company CFO has requested an app that contains visualizations applicable to analyzing the finance data. Each regional finance team will analyze their data and should only have access to the data in their region. The app must contain a high-level sheet that navigates to relevant detail sheets.

Which features support a logical design structure?

Options:

A.

A dashboard of KPIs and section access

B.

A pivot table that filters by region

C.

A Multi KPI with set analysis

D.

A dashboard with regional bookmarks

Question 12

A marketing team needs to display sales for a limited number of products by providing a bar chart that the user can control. The visualization has several requirements:

• Starts with the top five products

• Allows the user to change the number of products displayed

• Allows the user to scroll through all products on a mini chart

The business analyst creates a bar chat and a variable. Which steps should the business analyst complete next?

Options:

A.

• Add the slider object and use the variable to set its value

• Set the number of bars to custom and use the variable to set its value

B.

• Use the variable to fix the limitation

• Add an input box to enable the user to enter the required value

C.

• Use the variable to fix the limitation

• Add a slider object and use the variable to set its value

D.

• Add the slider object and use the variable to set its value

• Use the properties to set the number of bars to custom

Question 13

The VP of Finance is requesting a presentable solution that allows them to share finance information in monthly meetings with C-suite executives. Given the monthly meeting agendas, the solution must be customizable.

Which Qlik Sense feature should be implemented to meet this requirement?

Options:

A.

Storytelling

B.

Insight Advisor Chat

C.

Action Buttons

D.

Bookmarks

Question 14

A business analyst is working with retail data for consumer products. The customer is interested in the following:

• Ability to look for outliers on sales volume and margin %

• Ability to understand the clustering of products visually

• Ability to see products that are above the median sales volume

Which action should the business analyst take to implement these requirements?

Options:

A.

Create a pivot table and color the sales volume cell using K-Means function and median sales volume as an additional column

B.

Create a treemap visualization showing sales volume and margin% by product with the median sales volume in the title

C.

Create a combo chart with K-Means colors for the bar and a line measure representing median sales volume

D.

Create a scatter plot using K-Means to color the products and add a median sales volume reference line

Question 15

Refer to the exhibit.

The users of a Qlik Sense app report slow performance. The app contains approximately 10 million rows of data. The business analyst notices the following KPI master measure definition:

Left{ Trim( TransactionName), 1 ) * Right ( TransactionName, 5) Which steps should the business analyst complete to improve app performance?

Options:

A.

Ask the developer of the underlying database to change the structure of the field TransactionName.

B.

• In the Data manager, use the Split function to split the field values with the underscore character as the separator.

• In the Data manager, use the Add calculated field function to multiply the 1st and the 3rd column of the split field.

• Reload the data.

C.

Change the master measure definition as follows:

subfield( TransactionName, '',!)* subfieldl TransactionName, ' ', 3)

D.

In the Data manager, use the Replace function to remove the middle part of the field TransactionName

Page: 1 / 4
Total 50 questions