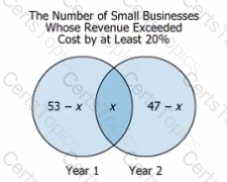
A city's chamber of commerce has the following goal for small businesses: revenue should be at least 20% greater than costs. The Venn diagram indicates that x is the number of small businesses that both in Year 1 and in Year 2 met the goal. The diagram also indicates that 53 - x is the number of small businesses that met the goal in Year 1 but not in Year 2, and that 47 - x is the number of small businesses that met the goal in Year 2 but not in Year 1.


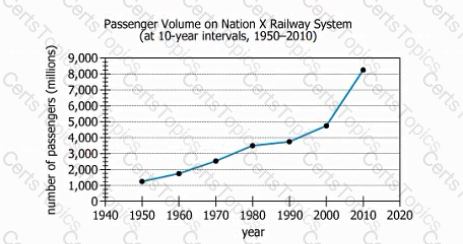
At 10-year intervals from 1950 through 2010, the graph shows the total number of passengers, in millions, on the railway system of Nation X. From each drop-down menu, select the option that creates the most accurate statement based on the information provided.

The graph shows the mean, the median, and the mode of monthly rents for apartments in a certain European city in 2008, 2009, and 2010. During each of these years, a large number of the residents of this city rented apartments. All of the rents were In whole euros (€).
Select from the drop-down menus the options that create the statement that K most strongly supported by the information provided.

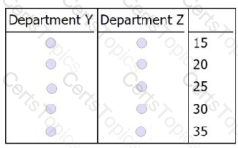
Each of the 75 employees at @ certain company works in exactly one of the company's 3 departments (Departments X, Y, and Z). Exactly 20% of the employees work in
Department X, and 10 fewer employees work in DepartmentY than work in Department Z.
Based on the information provided, select for Departinent Yand Department Zthe numbers of employees who work in Department Y and Department Z. Make only
two selections, one in each column.
