You need to create the On-Time Shipping report. The report must include a visualization that shows the percentage of late orders.
Which type of visualization should you create?
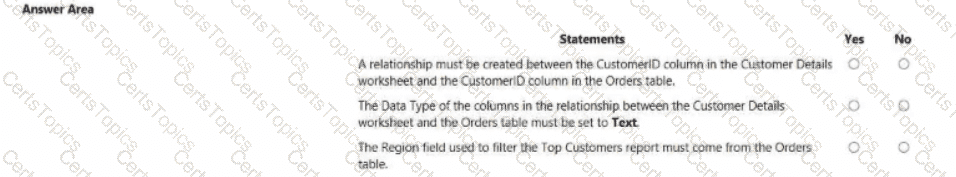
You need to design the data model and the relationships for the Customer Details worksheet and the Orders table by using Power BI. The solution must meet the report requirements.
For each of the following statement, select Yes if the statement is true, Otherwise, select No.
NOTE: Each correct selection is worth one point.
You create a report by using Microsoft Power BI Desktop.
The report uses data from a Microsoft SQL Server Analysis Services (SSAS) cube located on your company’s internal network.
You plan to publish the report to the Power BI Service.
What should you implement ta ensure that users who consume the report from the Power BI Service have the most up-to-date data from the cube?
Note: This question is part of a series of questions that present the same scenario. Each question in the series contains a unique solution that might meet the stated goals. Some question sets might have more than one correct solution, while others might not have a correct solution.
After you answer a question in this section, you will NOT be able to return to it. As a result, these questions will not appear in the review screen.
You have an on-premises data gateway.
You need to reduce the amount of data sent through the gateway by semantic models that run in Import storage mode.
Solution: You create aggregations to summarize results.
Does this meet the goal?
Copyright © 2021-2026 CertsTopics. All Rights Reserved