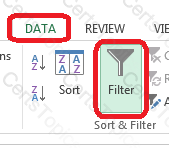
Create a combo chart.
Cell range B4:I299 on "Montly_Billing" worksheet
Horizontal axis label range: "Date" (column D)
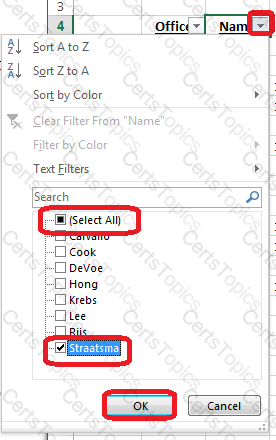
First data series range: All cells in "Duration" (column H) with a value of "Straatsma" in name (column C)
Second data series range: All cells in "Charge" (column I) with a value of "Straatsma" in name (column C)
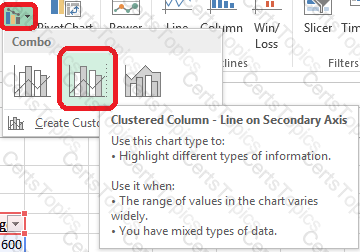
Type: Combo Chart
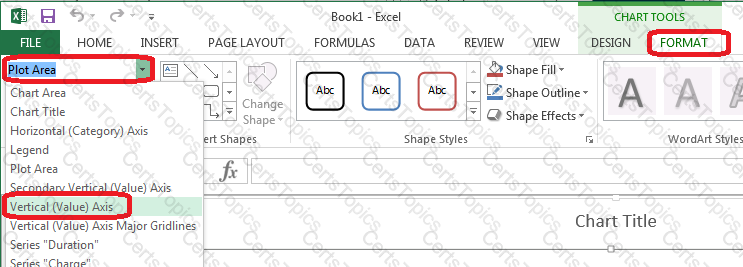
"Duration" series: Clustered Column (Primary Axis)
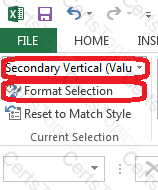
"Charge" series: Line (Secondary Axis)
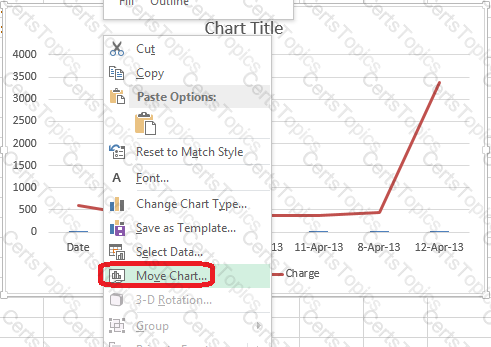
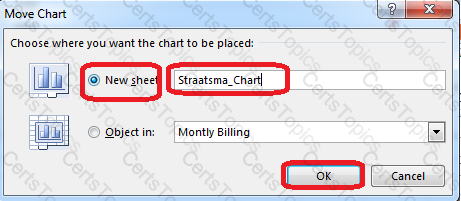
New Worksheet "Straatsma_Chart"
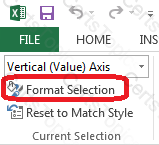
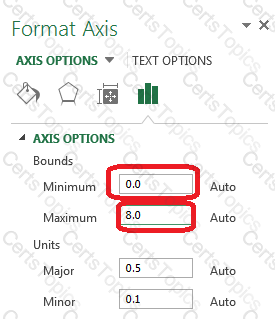
Primary Axis Bounds:
Minimum ("0.0")
Maximum ("8.0")
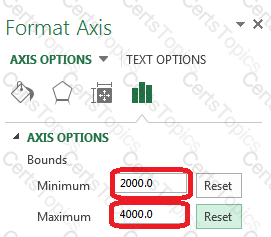
Secondary Axis Bounds:
Minimum ("2000.0")
Maximum ("4000.0")
Copyright © 2021-2025 CertsTopics. All Rights Reserved