Which of the following steps do you take to import an SAP SuccessFactors-provided story report template? Note: There are 3 correct answers to this question.
In a live data query, what are user-prompted filter types? Note: There are 2 correct answers to this question.
You are creating a Story report on Job Classifications. You have configured the chart, table, and input control on the canvas, as displayed in the screenshot. How do you set the input control?
An administrator creates a new MDF object for storing attachments related to an employee's dependents. After uploading some test data, the administrator states they are unable to report on the new data with Advanced Reporting tool in a canvas report. The administrator is working for a client that has already had their system transitioned to Workforce Analytics on SAP HANA. How can the administrator quickly make the data available for reporting?
You want to create a report that returns only employees who were born in 1961. You also want to enable the person who runs the report to specify a different birth year. How can you achieve this? Note: There are 2 correct answers to this question.
Select Date Options from the Toolbar. Set Date Type to Show All. Select Manage Run Time Filters from the Toolbar. Expand Personal Information table. Select Date of Birth column. Select OK.
You create a report page and want to change the grid column width and grid row height of the Page Designer. Where can you do this?
You want to create a page in a canvas report that includes a custom image, a user editable title centered underneath the image, and the current date in the top-right corner. Which combinations of components can you use to accomplish this? Note: There are 2 correct answers to this question.
Why is it important to consider the People step of the report definition when you share a table report with another user?
Within a Story, you create a query using the Basic User Information table. After you add the Proxy Information table, you notice that some of the basic information records are NO longer displayed in the preview. How do you adjust the query to return the missing records in the preview?
You are using a Multi-Dataset table report without Business Intelligence Reporting Tools (BIRT). What are characteristics of the report output? Note: There are 2 correct answers to this question.
Which are valid destinations of a scheduled Report Distributor bundle? Note; There are 3 correct answers to this question.
Which permissions should you assign to allow a user to add a new story that will include Career Development Planning data? Note: There are 2 correct answers to this question.
User A creates a dashboard with four tiles. When User B accesses the dashboard, only three tiles are visible. Why can User B see only three tiles?
What is included in the saved state of a bookmark for a Story report? Note: There are 3 correct answers to this question.
When using Report Center, what permissions are required to create a canvas report on Employee Profile data using the Detailed Reporting tool? Note: There are 3 correct answers to this question.
In addition to any chart filter you may have applied to your chart, which other filters may be affecting the chart filter, due to the Cascading effect in a Story? Note: There are 2 correct answers to this question.
Which actions can you perform in a Simple Text component? Note: There are 3 correct answers to this question.
You are working with nested labels on your instance in Report Center.
How do you configure the labels as displayed in the screenshot? Note: There are 2 correct answers to this question.
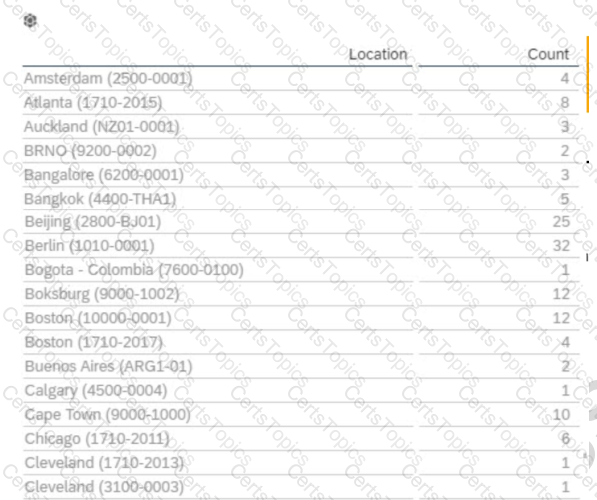
How do you configure the Builder to display the table in the screenshot in a story report? Note: There are 3 correct answers to this question.
How do you give an analyst permission to build tiles?
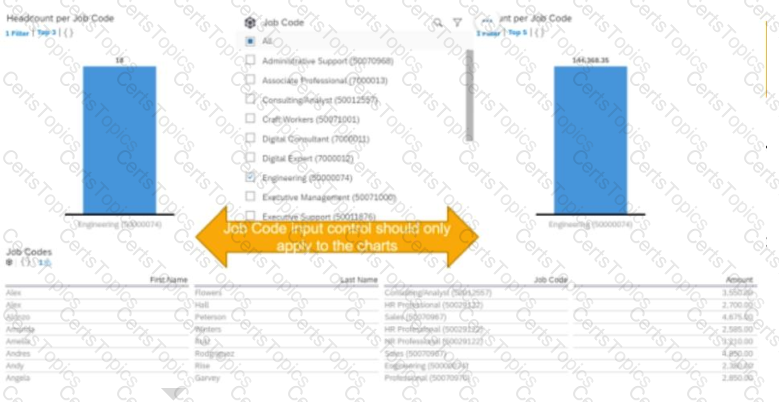
You are creating a Story report on employment and compensation information. You have created two queries to support the story report. The table and the left chart are using an employment query as its data source. The right chart uses a compensation query as its data source. Both queries include the field for the employee Job Title. When you add an input control to the page, it only filters the table and the left chart. What action must you take to configure the input control to effect both charts and the table?
A user reports they are unable to successfully create a new Story report in Report Center. The page is stuck in a blank loading screen. How do you validate the user exists and has the proper configuration in the SAP Analytics Cloud Solution?
When you create a table report with filter groups, what is the logical relationship between filter groups?
What happens when you enable inline translation of a Story as it relates to future edits of the Story report? Note: There are 2 correct answers to this question.
Copyright © 2021-2025 CertsTopics. All Rights Reserved