A Data Analyst has a large data source that contains more than 10 million rows. Users can filter the rows by a field named Animal.
The following is a sample of the data.

The analyst wants to ensure that every calculation is affected by including only animals of a particular type.
Which type of filter should the analyst create on the worksheet?
A colleague provides a Data Analyst with access to a folder that contains the following files:
Sales.csv
Book1.twb
Sales.hyper
Export.mdb
Which file is a Tableau extract?
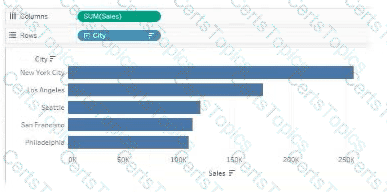
A Data Analyst has the following chart that shows the sum of sales made in different cities.

The analyst wants to show the average sale amount for a city when users hover their mouse over any of the bars.
What should the analyst do?
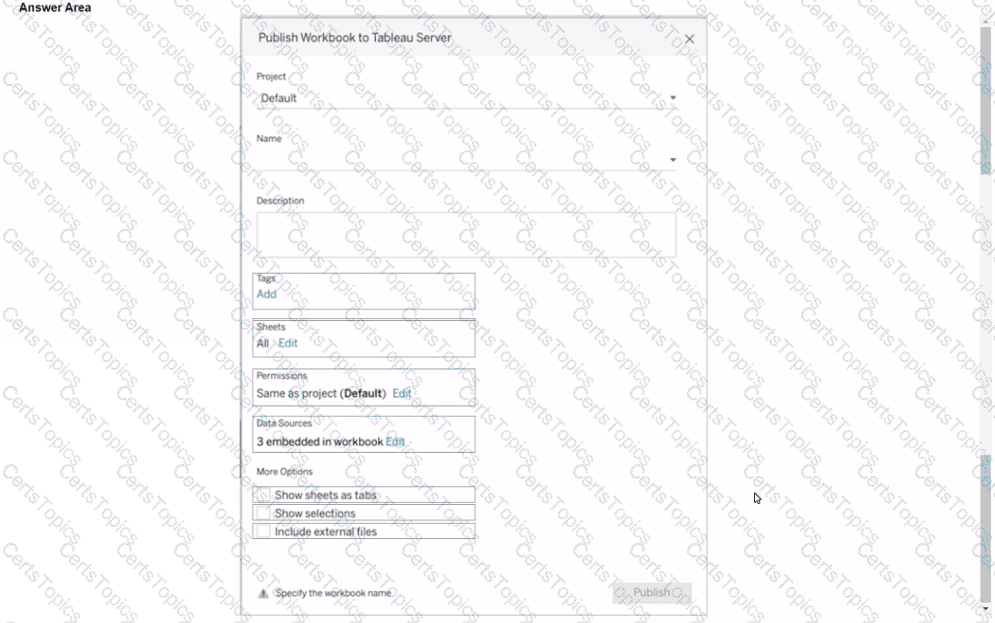
You plan to publish a workbook to Tableau Server.
You want to ensure that users can see other published dashboards from their current dashboard.
Which setting should you configure? (Click the appropriate Option in the Answer Area.)
